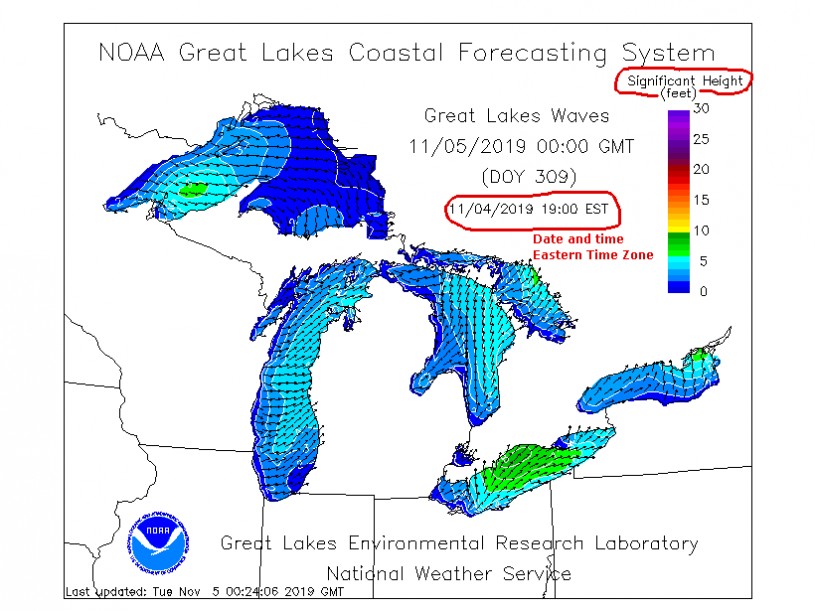
Short explanation of what is what on GLERL-GLCFS wave charts The diagrams come directly from GLERL GLCFS. Here is an example:

First and foremost take a note of date and time for the Nowcast or Forecast chart - that's the target product date and time. Colors on the legend (right side) denote wave Significant Height. For example, dark blue means 0ft, all regions of the same color represent this wave height. So if you see dark blue - that means, no waves. The lighter and "warmer" the color - the bigger waves are forecasted.
Arrows on lakes' silhouettes show direction of waves.
|